Introduction:
Poverty reduction in India has been a critical focus of government policy and academic research for decades. Historically, India made significant progress in reducing poverty, with poverty rates falling from 37% in 2004-05 to 22% in 2011-12. However, recent research titled “Poverty Decline in India after 2011–12: Bigger Picture Evidence” published in the journal “Economic and Political Weekly” shows that this progress has slowed down significantly since 2011-12. The research article estimates that poverty will decline by only about 18% between 2011-12 and 2022-23.
Understanding Poverty Measurement in India:
- Poverty in India has traditionally been measured based on the expenditure required to meet minimum calorie needs. From the late 1970s until 2005, poverty lines were defined using calorie intake norms updated every five years with data from the National Sample Survey Office (NSSO). The Tendulkar Committee later revised these estimates by including broader consumption patterns and better measurement techniques.
- However, since 2011-12, the government has not released any official poverty estimates, leading to a reliance on unofficial studies with varying methodologies and conclusions. This lack of official data has made it difficult to get a clear picture of poverty trends in recent years.
Challenges in Measuring Poverty:
The paper highlights three main approaches used by researchers to estimate poverty post-2011-12:
1. Use of NSSO Socio-Economic Surveys
Researchers often rely on NSSO’s Household Consumption Expenditure Survey (HCES) data. However, the 2017-18 HCES was scrapped due to “methodological issues,” leaving a gap. The 2022-23 HCES uses a new measurement called Usual Monthly Per Capita Consumption Expenditure (UMPCE), based on a single question without clear definitions. This makes it incomparable with earlier surveys. Using this method, poverty estimates for 2019-20 ranged between 26-30%.
2. Scaling Based on National Accounts Statistics
Economist Surjit Bhalla and colleagues used growth in Private Final Consumption Expenditure (PFCE) from the National Accounts Statistics to scale up consumption data from 2011-12. This approach assumes that growth rates in official consumption data can approximate poverty trends.
3. Survey-to-Survey Imputation Methods
This method fills data gaps by combining information from related surveys. The authors of the paper use this approach, which was also employed by World Bank researchers. Himanshu and colleagues improved upon previous attempts by using employment surveys similar in design to the consumption surveys, enhancing data comparability. They also estimated poverty at the state level, allowing for more precise regional analysis.
Key Findings on Poverty Trends:
Using their improved imputation method and the Tendulkar Committee poverty lines, the authors found that poverty declined sharply from 37% in 2004-05 to 22% in 2011-12. However, from 2011-12 to 2022-23, the decline was much slower, reaching only about 18%. This means the number of poor persons fell from approximately 250 million to 225 million—a modest reduction compared to previous years.
State-level data reveal significant variations. Uttar Pradesh, India’s most populous state, showed marked progress in poverty reduction. Conversely, states like Jharkhand and Bihar exhibited much slower progress, and in some large states like Maharashtra and Andhra Pradesh, poverty reduction appeared to have stagnated.
Supporting Evidence from Economic Indicators:
The slowdown in poverty reduction aligns with broader economic trends:
- GDP Growth: India’s GDP growth rate slowed from an average of 6.9% per year between 2004-05 and 2011-12 to 5.7% from 2011-12 to 2022-23.
- Wage Growth: Real wage growth in rural India declined from 4.13% annually (2004-05 to 2011-12) to 2.3% (2011-12 to 2022-23), based on Labour Bureau data.
- Agricultural Employment and Productivity: The number of agricultural workers declined by 33 million between 2004-05 and 2011-12, and again by 33 million by 2017-18, but then increased by 68 million after 2017-18. This rise corresponded with a decline in agricultural productivity growth, contributing to lower wages and higher poverty in rural areas.
Debate on Poverty Underestimation:
- Arguments for Underestimation: Methodological inconsistencies and changes in data collection (like the modified mixed reference period) lead to higher reported consumption, which can artificially lower poverty estimates if older poverty lines are used. Some estimates suggest poverty could be around 25% in 2022-23, based on alternative poverty lines like the Rangarajan Committee’s.
- Arguments Against Underestimation: Others argue that poverty has drastically reduced due to strong GDP growth, government programs, and food security laws. Using multiple methods, some researchers estimate poverty near 10% in 2022-23. These views stress that poverty should be measured broadly beyond calorie consumption.
Data Collection Issues and Rural-Urban Divide:
The Household Consumption Expenditure Survey (HCES) has methodological challenges:
- The shift from the Uniform Reference Period (URP) to the Modified Mixed Reference Period (MMRP) aims to better capture spending patterns but makes comparison with older data difficult.
- Some argue that MMRP provides a more accurate picture of consumption, including infrequent expenses.
- Urban-rural poverty gaps appear to be narrowing, with rural consumption patterns becoming more urban-like. However, the rural-urban classification is outdated, as many rural areas have become peri-urban.
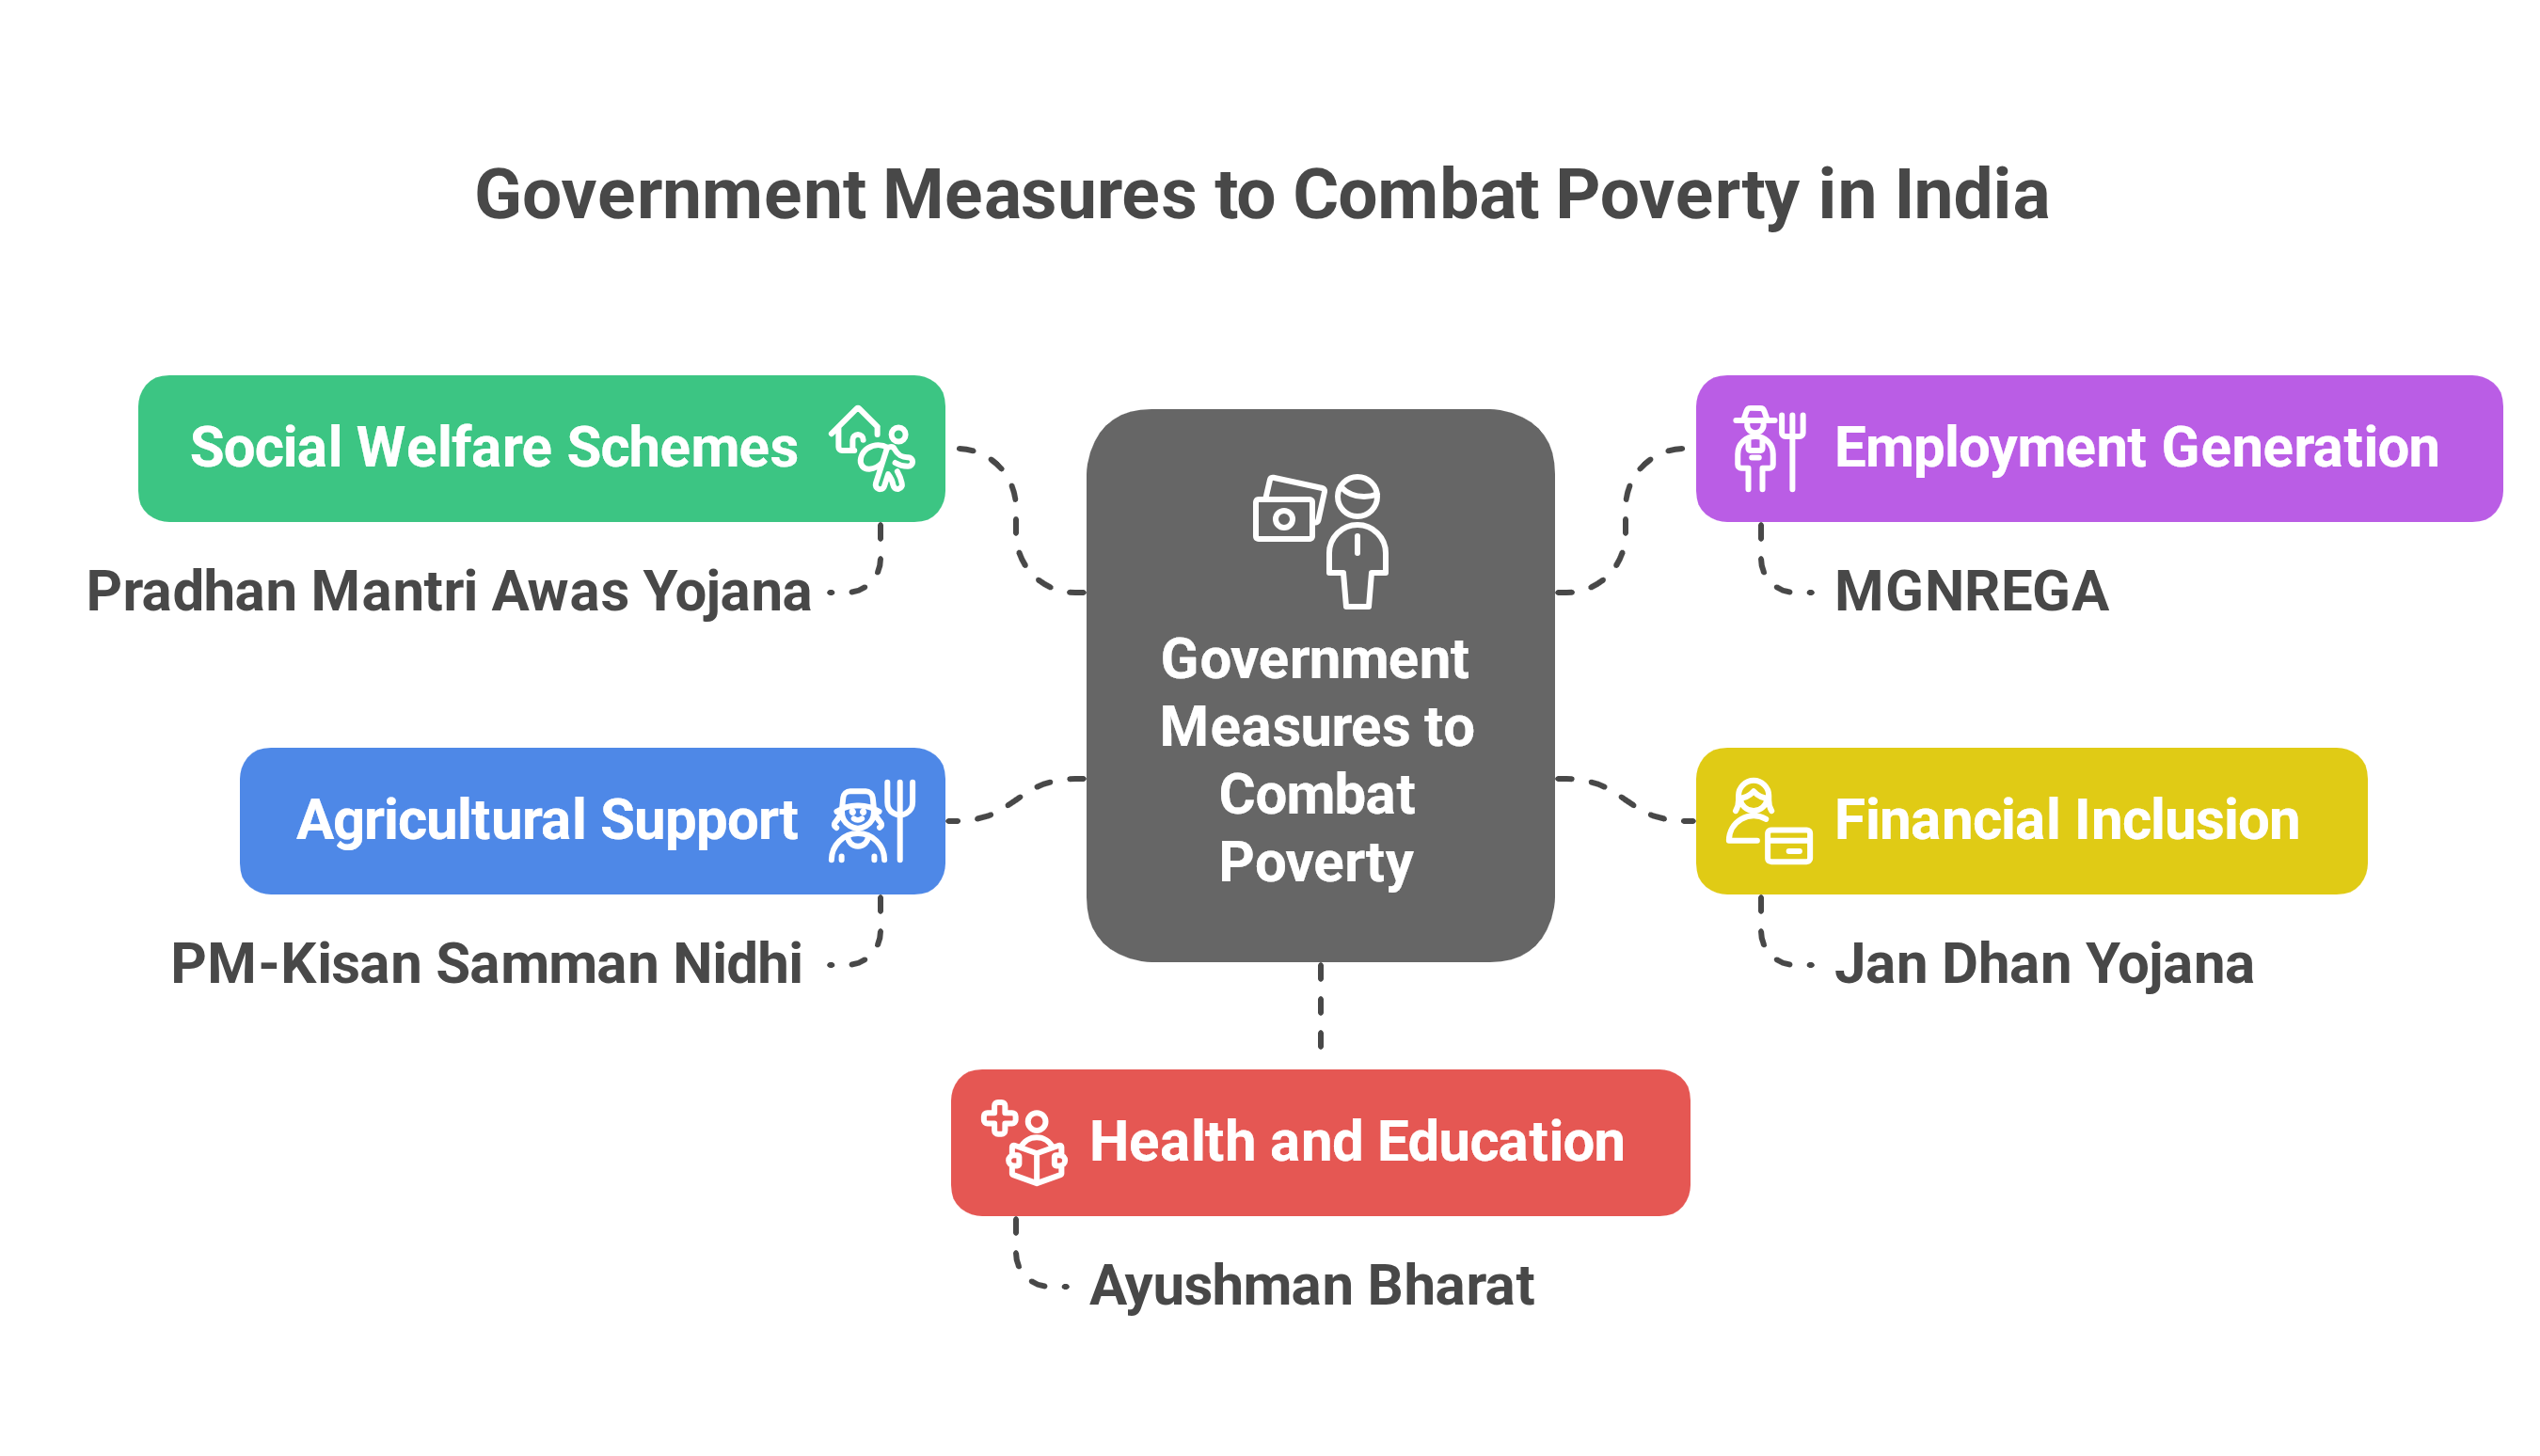
Government Measures to Combat Poverty:
India’s government has implemented various programs to reduce poverty and support vulnerable populations:
- Social Welfare Schemes: Programs like Pradhan Mantri Awas Yojana aim to provide affordable housing.
- Employment Generation: Initiatives such as the Mahatma Gandhi National Rural Employment Guarantee Act (MGNREGA) create rural jobs to boost income.
- Financial Inclusion: Efforts like the Jan Dhan Yojana increase access to banking and financial services for the poor.
- Agricultural Support: Schemes like PM-Kisan Samman Nidhi provide direct income support to farmers.
- Health and Education: Programs such as Ayushman Bharat offer health insurance, while investments in education aim to improve long-term economic prospects.
Conclusion:
While India made remarkable progress in poverty reduction up to 2011-12, recent data and research suggest that this progress has slowed significantly. Measurement challenges and the lack of official poverty data complicate the picture, but economic indicators and state-level trends reinforce concerns about stagnation. Accelerating poverty reduction will require renewed policy focus, improved data collection, and targeted efforts in lagging states and sectors. Only with accurate data and sustained policy action can India hope to achieve more inclusive and sustained poverty alleviation in the coming years.
| Main question: Poverty reduction trends in India vary significantly across states. Evaluate the socio-economic factors responsible for the differing pace of poverty alleviation in states like Uttar Pradesh and Bihar. How can targeted policy interventions help bridge this disparity? |


