Context:
India has made significant strides in reducing poverty over the past decade, lifting 171 million people out of extreme poverty, as highlighted in the World Bank’s Spring 2025 Poverty and Equity Brief. This achievement underscores India’s commitment to inclusive development and reflects the impact of targeted government policies, welfare schemes, and economic reforms designed to uplift millions. Drawing upon data from the 2011–12 and 2022–23 consumption surveys, the report provides a comprehensive analysis of improvements in both monetary and multidimensional poverty indicators.
Key Findings
The World Bank’s report emphasizes India’s remarkable journey in poverty reduction, marking a steep decline in extreme poverty from 16.2 percent in 2011-12 to just 2.3 percent in 2022-23. Considering the global benchmark for extreme poverty—living on less than USD 2.15 per day—this reduction is particularly noteworthy. Furthermore, the report illustrates India's success in reducing poverty across both rural and urban landscapes, providing a holistic portrayal of the country’s achievements.
Rural and Urban Poverty Trends
India's success story is spread across both rural and urban landscapes:
- Rural Areas: Extreme poverty reduced from 18.4% in 2011–12 to 2.8% in 2022–23.
- Urban Areas: Extreme poverty fell from 10.7% to 1.1% in the same period.
Moreover, the rural-urban poverty gap narrowed substantially, from 7.7 percentage points in 2011–12 to 1.7 percentage points in 2022–23, reflecting a 16% annual decline. This convergence indicates the effectiveness of poverty reduction strategies across diverse demographic settings.
Lower-Middle-Income Poverty Reduction
Substantial progress has also been made at the lower-middle-income threshold (3.65 USD per day):
- The poverty rate dropped from 61.8% in 2011–12 to 28.1% in 2022–23.
- Approximately 378 million people moved out of poverty at this income level.
- In rural areas, poverty declined from 69% to 32.5%, and in urban areas, from 43.5% to 17.2%.
The rural-urban gap at this level reduced from 25 percentage points to 15 percentage points, with a 7% annual decline observed between 2011–12 and 2022–23.
State-Level Contributions to Poverty Reduction
Certain key states have played an outsized role in India’s poverty alleviation:
- Uttar Pradesh, Maharashtra, Bihar, West Bengal, and Madhya Pradesh accounted for 65% of India's extreme poor in 2011–12.
- These five states contributed to two-thirds of the total reduction in extreme poverty by 2022–23.
This highlights the impact of targeted regional strategies and the importance of state-level initiatives aligned with national development goals.
Multidimensional Poverty Reduction
India’s progress extends beyond monetary dimensions, reflected in improvements in the Multidimensional Poverty Index (MPI), which includes indicators such as education, health, and living standards:
- MPI-based non-monetary poverty declined from 53.8% in 2005–06 to 16.4% in 2019–21.
- In 2022–23, the MPI figure further dropped to 15.5%, signaling continued enhancements in overall well-being.
Such multidimensional gains are crucial as they reflect sustainable and broad-based human development, rather than income growth alone.
Income Inequality Trends
India also recorded improvements in income distribution, as reflected by the Gini Index:
- The consumption-based Gini index fell from 28.8 in 2011–12 to 25.5 in 2022–23.
This decline indicates a modest but important reduction in income inequality, suggesting that economic gains have been relatively more evenly distributed compared to earlier periods.
Employment Growth and Shifting Workforce Patterns
- Since 2021-22, employment growth has outpaced the growth of the working-age population.
- The urban unemployment rate dropped to 6.6% in the first quarter of FY24/25, the lowest since 2017–18.
- Workforce shifts show male workers moving from rural to urban areas since 2018-19, reflecting urban economic dynamism.
- Rural female employment in agriculture has witnessed an upturn, highlighting the sector’s continuing significance.
|
Key Terms
|
- There has been a rise in self-employment, especially among rural workers and women, contributing to greater economic resilience and participation.
Historical Context of Poverty Estimation in India
Pre-Independence, early efforts by Dadabhai Naoroji (Poverty and the Un-British Rule in India), the National Planning Committee (1938), and the Bombay Plan (1944) laid the groundwork for understanding poverty.
Post-Independence, the Planning Commission (1962), followed by the work of V.M. Dandekar and N. Rath (1971), Alagh Committee (1979), and Lakdawala Committee (1993), contributed to developing methodologies for poverty estimation.
In the post-2000 era, the Tendulkar Committee (2009) introduced important methodological shifts, including moving away from calorie norms, establishing a uniform all-India Poverty Line Basket (PLB) for rural and urban areas, and recommending the use of Mixed Reference Period (MRP) estimates over Uniform Reference Period (URP). The Rangarajan Committee (2014), formed in response to criticism of the Tendulkar methodology, reverted to separate rural and urban PLBs for more accurate poverty estimates, though its recommendations were not formally adopted by the government.
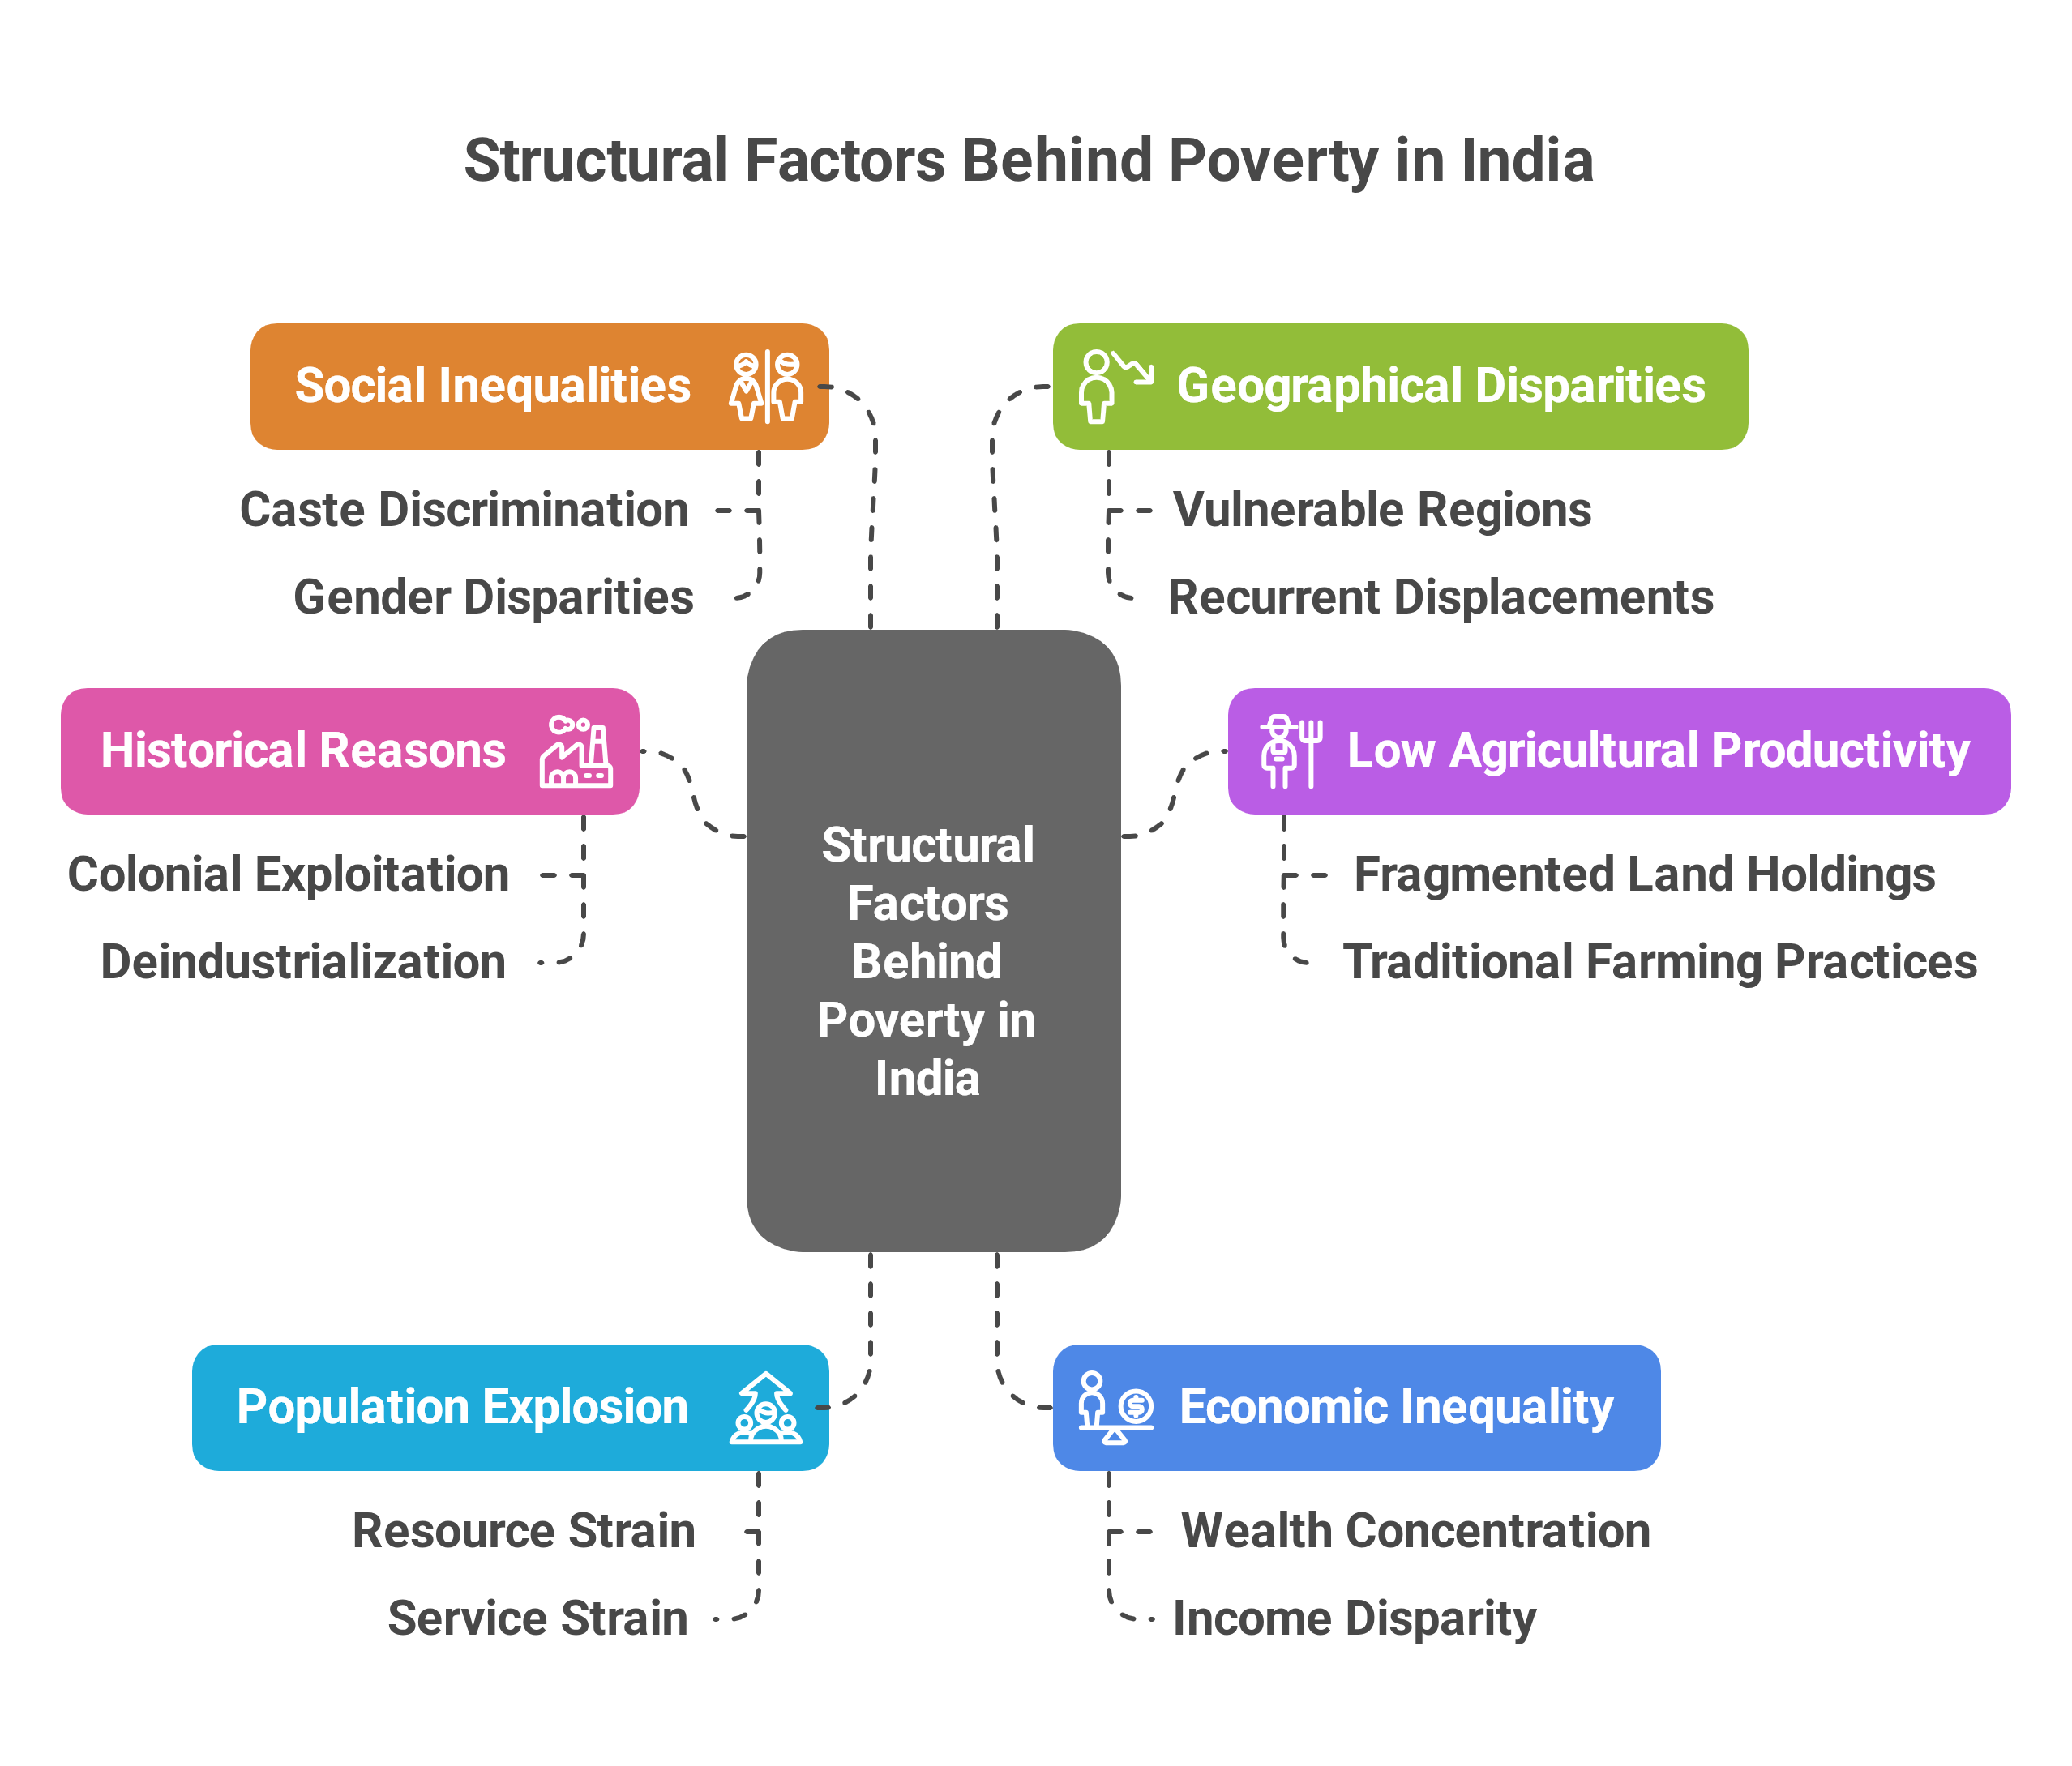
Structural Factors Behind Poverty in India:
- Historical Reasons: Colonial exploitation led to the destruction of indigenous industries, deindustrialization, and a drain of wealth. British policies converted India into a supplier of raw materials and importer of finished goods, impoverishing local farmers and artisans.
- Low Agricultural Productivity: Fragmented land holdings, lack of capital, and traditional farming practices have restricted yields, impacting farmers' incomes.
- Population Explosion: Rapid population growth has strained resources and services. India’s population is projected to peak at 1.7 billion by the early 2060s and will remain the most populous country throughout the century (UNDESA).
- Economic Inequality: Wealth is highly concentrated, with the top 10 percent of the population holding 77 percent of the national wealth (Oxfam).
- Social Inequalities: Caste discrimination and gender disparities limit access to education, employment, and resources. For instance, 53 percent of Indian women are outside the labor force due to care responsibilities (ILO).
- Geographical Disparities: Vulnerable areas such as dense forests, hilly terrains, and flood-prone regions like Assam and Bihar face recurrent displacements, perpetuating absolute poverty.
Conclusion
India’s achievements in reducing both extreme and lower-middle-income poverty reflect a well-rounded and sustained approach to inclusive development. The findings of the World Bank’s Spring 2025 Poverty and Equity Brief showcase the pivotal role played by economic reforms, targeted welfare policies, and improved access to essential services. The narrowing rural-urban poverty gap, declining multidimensional poverty, and positive employment trends signal broader social and economic improvements. Building on this foundation, India can continue advancing towards a more equitable, resilient, and prosperous future.
| Main question: India’s journey of poverty alleviation has been characterized by both monetary and non-monetary improvements. Critically examine the structural factors that contributed to poverty in India and evaluate the impact of recent poverty reduction efforts in bridging rural-urban disparities. |


